- 台股
- 新聞
- 訂閱電子報
專家讓您懂 |
投資講座 |
|
|
||
基金新聞 |
推薦新聞 |
點閱排行 |
你的新聞 |
|
|
||||
| 淨值日期 | 最新淨值 | 漲跌 | 漲跌幅% | 52周最高 | 52周最低 |
|---|---|---|---|---|---|
| 2022/11/30 | 12.9400 | ▲0.24 | ▲1.89 | 16.7700 | 11.3100 |
基金走勢 |
基金快遞 |
| 基金公司 | 聯博(盧森堡)公司 | ||
| 淨值 (2022/11/30) |
12.94000 | 計價幣別 | 美金 |
| 基金類別 | 全球新興市場股債混合 | ||
| 本年迄今收益% | -21.91 | 基金規模(百萬) (2024/04/30) |
590.43 |
| 申購手續費率 | 0.00% | 買回手續費率 | 0.00% |
| 基金管理費率 | 1.60% | 基金保管費率 | 0.50% |
資產配置 |
截至:2024/04 |
風險評估 |
| 標準差 | 夏普值 | Beta值 | Alpha值 | |
| 一年 | 21.10% | -1.08 | -0.05 | -21.64 |
| 三年 | 19.57% | -0.13 | 0.03 | -1.72 |
| 五年 | 17.40% | -0.18 | -0.03 | -1.70 |
| 十年 | 14.38% | -0.01 | 0.02 | 0.54 |

行業比重 |
截至:2024/04 |
| 行業類別 | 百分比% |
| Banks | 14.14 |
| Hardware | 9.38 |
| Semiconductors | 9.16 |
| Retail -Cyclical | 4.43 |
| Vehicles & Parts | 4.39 |
| Interactive Media | 4.34 |
| Insurance | 3.05 |
| Telecommunication Services | 2.56 |
| Real Estate | 2.00 |
| Farm & Heavy Construction Machinery | 1.96 |
| Consumer Packaged Goods | 1.67 |
| Manufacturing - Apparel & Accessories | 1.41 |
| Oil & Gas | 1.40 |
| Metals & Mining | 1.23 |
| Asset Management | 1.15 |
| Utilities - Regulated | 1.14 |
| Retail - Defensive | 0.81 |
| Travel & Leisure | 0.76 |
| Agriculture | 0.72 |
| Other Energy Sources | 0.52 |
| Building Materials | 0.47 |
| Transportation | 0.33 |
| Education | 0.30 |
| Conglomerates | 0.29 |
| Industrial Products | 0.24 |
| Credit Services | 0.24 |
| Capital Markets | 0.24 |
| Medical Devices & Instruments | 0.21 |
| Steel | 0.19 |
| Aerospace & Defense | 0.16 |
| Drug Manufacturers | 0.13 |
| Utilities - Independent Power Producers | 0.10 |
| Construction | 0.10 |
| Restaurants | 0.07 |
| Software | 0.07 |
| Healthcare Providers & Services | 0.07 |
| Media-Diversified | 0.06 |
| Business Services | 0.04 |
| Medical Distribution | 0.02 |
| Tobacco Products | 0.02 |
| Furnishings, Fixtures & Appliances | 0.01 |
前十大持股 |
截至:2023/03 |
| 投資標的 | 資產百分比% |
| Taiwan Semiconductor Manufacturing Co., Ltd. | 2.72 |
| Alibaba Group Holding Ltd. - Class H | 2.23 |
| Kia Corp. | 1.89 |
| PetroChina Co., Ltd. - Class H | 1.83 |
| GAIL India Ltd. | 1.74 |
| Agricultural Bank of China Ltd. - Class H | 1.72 |
| POSCO Holdings, Inc. | 1.65 |
| Hana Financial Group, Inc. | 1.59 |
| AB SICAV II - China Equity Portfolio - Class S | 1.56 |
| Tencent Holdings Ltd. - Class H | 1.56 |
基金速覽 |
||||||||||||
|
淨值美金
12.9400
▲1.89%
|
||||||||||||
過去績效 |
資料日期:2022/11/30 |
|||||||||||
|
||||||||||||
基準指數 |
||
|
基金指數 Morningstar 基準指數 |
||
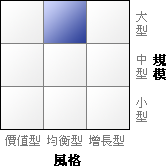
Moningstar 風格箱 |
熱門點閱排行 |
||
你的最愛 |
||
最近點閱 |
||||||||
|
||||||||
看此基金的人也看了 |
||

|
|

